Category: supply chain management

  • The Case for Setting High-Level KPIs

    The Case for Setting High-Level KPIs

    In many organizations, everything that can be measured is measured: number of pallets moved, average processing time, productivity down to the minute. This obsession with detail often gives the impression of tight control over activity, but it hides a deeper weakness: a lack of overall vision. When organizations limit themselves to purely operational KPIs, they risk falling into micro-management or, worse, into local optimizations that harm overall performance.

    That’s why it is crucial to establish a cascade of indicators that connects the strategic, tactical, and operational levels. In other words, the right KPIs should help steer the organization as a whole, not just monitor its every move.

    Thinking higher: KPIs as a lever for coherence

    The first benefit of aiming for strategic and tactical KPIs is alignment. A good strategic indicator—such as profitability, customer satisfaction, or market share—helps maintain focus on the company’s top priorities. But that’s not enough. Those objectives also need to be translated across departments into concrete levers. This is where tactical KPIs come into play.

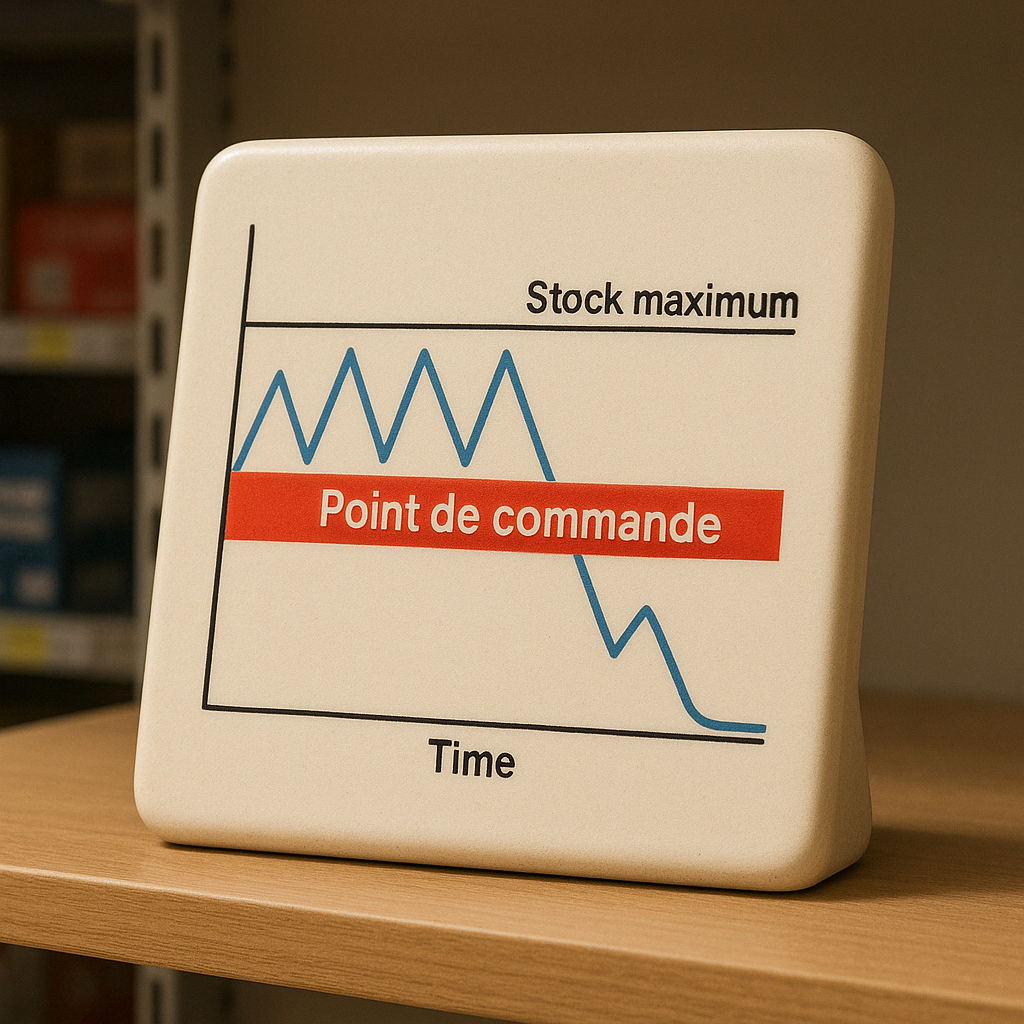
    Take the example of service level. It doesn’t just show whether the customer gets what they expect; it also reflects the effectiveness of several upstream processes: inventory management, processing speed, logistical coordination. By measuring this kind of indicator, we ensure that day-to-day actions contribute to broader objectives rather than just the execution of individual tasks.

    Moreover, these “intermediate” KPIs encourage accountability within teams. Instead of imposing a method or scrutinizing activity volumes, we define a target to achieve and leave freedom in how to get there. It’s a way of managing through results rather than through control.

    Tactical KPIs: accelerators of continuous improvement (or when the tree hides the forest)

    It’s often said that, when faced with daily urgencies and incidents, the tree hides the forest: we focus on what screams the loudest, without noticing underlying drifts. Tactical KPIs then serve as intermediate observers: close enough to the field to remain actionable, yet able to capture structural trends invisible to overly detailed operational indicators.

    In a DMAIC (Define–Measure–Analyze–Improve–Control) approach, these KPIs play a key role starting in the Measure phase, by reliably quantifying recurring gaps (service level, inventory turnover, etc.). The results feed into the Analyze phase, which searches for root causes, before testing targeted actions in Improve. Finally, the same indicator serves as a safeguard in Control to verify the sustainability of gains. Rather than simply fixing the falling tree, we plan the management of the whole forest: tactical KPIs become true facilitators of mid-scale improvement.

    The strength of tactical KPIs lies in their usefulness for investigation, narrowing down intervention zones through effective data breakdowns. This level of indicator acts like an analytical compass: it narrows the scope to plausible causes, avoiding wasted time exploring everywhere at once. It also helps identify correlations and recurring patterns that reveal systemic problems often invisible to the naked eye.

    In this sense, tactical KPIs become triggers for targeted analysis. Rather than questioning everything, they help formulate solid hypotheses to be tested in a structured approach such as DMAIC. This intelligent targeting makes improvement efforts faster, more effective, and better supported by data. It is then up to the analyst to formulate and test a more precise hypothesis about the causes of the issue under investigation, in order to trigger a new investigation loop.

    This level of investigation is only achievable once tactical indicators are measured, because otherwise it becomes difficult to prioritize intervention zones without large-scale data.

    The art of designing relevant KPIs

    Every well-run organization steers its decisions by its strategic vision. It is possible to develop measurable objectives aligned with this vision, and these objectives will be tracked through strategic KPIs. From these strategic KPIs flow tactical KPIs, tied to actions that will help the organization reach its strategic goals.

    To increase data relevance, I would add that it is always preferable to store this information inside a data cube, where analysts can easily pivot across multiple dimensions and run characteristic-based analyses. Compared to a dashboard or a simple pre-formatted report, analysis cubes enable proactive problem-solving. And that’s without even mentioning operational reports, which are only used to drill down into each transaction in the system.

    Conclusion

    A good KPI system is not limited to measuring what is easiest to quantify. It must reflect what is essential to guide, correct, and evolve the organization. By intelligently linking the strategic, tactical, and operational levels, indicators become more than numbers: they become levers of coherence, triggers for continuous improvement, and high-value decision-making tools.

    Tactical KPIs, in particular, prevent the tree from hiding the forest. They help with prioritization, direct efforts where they matter most, and transform intuitions into structured analyses. Well designed, well placed, and used within analytical tools like data cubes, they form the foundation of a culture of sustainable, proactive optimization aligned with organizational strategy.

    Instead of getting bogged down in details or steering blindly, it then becomes possible to navigate with precision, clarity… and impact.

  • Risk-Based Safety Stock: A Definitive Approach

    Risk-Based Safety Stock: A Definitive Approach

    In a world dominated by giants like Amazon, it’s increasingly critical for brick-and-mortar retailers to meet customer demands as quickly as possible. One way to achieve this is by ensuring that stock is readily available; otherwise, customers may turn to competitors. Deciding how much stock to keep on the floor is crucial and likely at the heart of a retailer’s operations. In this article, we’ll focus on the importance of considering safety stock determination as a risk mitigation analysis measure.

    A General Risk Analysis

    The first step in risk management analysis is simply identifying the risk. For retailers, the risk corresponds to running out of stock.

    Suppose you’re a company that manages operations very well, always orders on time, and has perfect inventory tracking. Let’s go even further: your minimum stock always matches your sales forecasts over your replenishment lead time. Well, guess what? That’s not enough to prevent you from occasionally running out of stock! It’s normal; inventory shortages are subject to random variables beyond your control. See where I’m going?

    Why do we run out of stock, you ask? There are two main causes, each requiring specific management:

    • Cause 1: Actual sales during the replenishment lead time exceeded expectations. This is a good problem to have but still carries a significant opportunity cost.
    • Cause 2: The replenishment delivery lead time was longer than promised.

    These are the only two causes I’ve observed. We’ll discuss possible mitigation measures in the following sections.

    Cause 1: Sales Were Higher Than Expected

    Why were sales higher than forecasted? The answer is simple: you’ll never achieve perfect forecasting. Of course, it’s always better to make higher-quality forecasts, but regardless of the reason, if there’s always a discrepancy between actual and forecasted sales, it indicates an inherent difficulty in making perfect predictions, and this difficulty is measurable. To protect against this, you should establish a safety stock.

    In this case, your reorder point should equal your sales forecast over the lead time plus what we call the safety stock (yes, using the well-known formula that accounts for the desired service level and your forecast error).

    Cause 2: Replenishment Lead Time Was Longer Than Expected

    Similar to Cause 1, this is again a variable dependent on the predictability of delivery lead time. Even with forecasts based on a specific lead time, if the duration of that lead time changes, the next replenishment might not arrive on time.

    You can probably see where this is going: we need to measure this unpredictability and convert it into the number of additional units to keep in stock. The conversion is straightforward: we transition from coverage in days to quantity. At this point, we take the sales forecast we plan to make over the coverage period to convert.

    You can follow the same approach as in the previous section and apply it to delivery lead times once all coverage components have been converted into quantities.

    Discussion

    From a practical standpoint, I’ve often been told that considering safety stock as a risk analysis approach is more burdensome than simply determining a desired coverage between replenishments, or just setting a fixed quantity as safety stock.

    The reasoning behind those who prefer these methods is simple: they claim they don’t really have the time (according to them) to manage the system’s deviations. To that, I respond that the system might be poorly tuned if they’re making such statements. It’s easier to input a coverage duration that’s a bit longer than the lead time. There’s only one figure to enter per product, which makes it easy for them to feel in control. Additionally, if sales are higher, the safety stock will also be higher, which is easy to explain, because sales are often easier to consult than sales forecast deviations. To those who bring up this argument, I reply that in a well-tuned system, they also have only one parameter per product (in our case, the desired level of confidence).

    However, the compelling argument I would give them isn’t related to ease of management. In fact, I would argue that a client using methods based on arbitrary coverage lacks information, namely whether the coverage entered is sufficient for the most problematic and hardest-to-forecast situations. I’ve often been given the example of products that are only sold on special order (typically large ones). These are the types of products that are difficult to forecast because the forecasted sales volume is low compared to the volume of confirmed sales. Let’s say it’s product A in the ABC class, because you can’t do without a sale. It’s highly likely that this product is hard to forecast. We don’t know when the exceptional sale will occur, but we know we are always at risk. So, what do we do in this case? We simply increase our reserves, which comes down to measuring our level of uncertainty regarding the sales forecasts and linking that information to our desired service level for that product. This approach is somewhat of a catch-all method, which helps identify products that need the most attention by applying the same rule to everyone.

    Conclusion

    This article has attempted to convince you that determining safety stock should be part of a risk management approach, and the risk in question is the risk of running out of stock when the customer is ready to buy your product. Two tools that help measure and address this risk have been presented: one to mitigate the risk of selling more stock than expected, and the other to protect against uncertainties in delivery time.